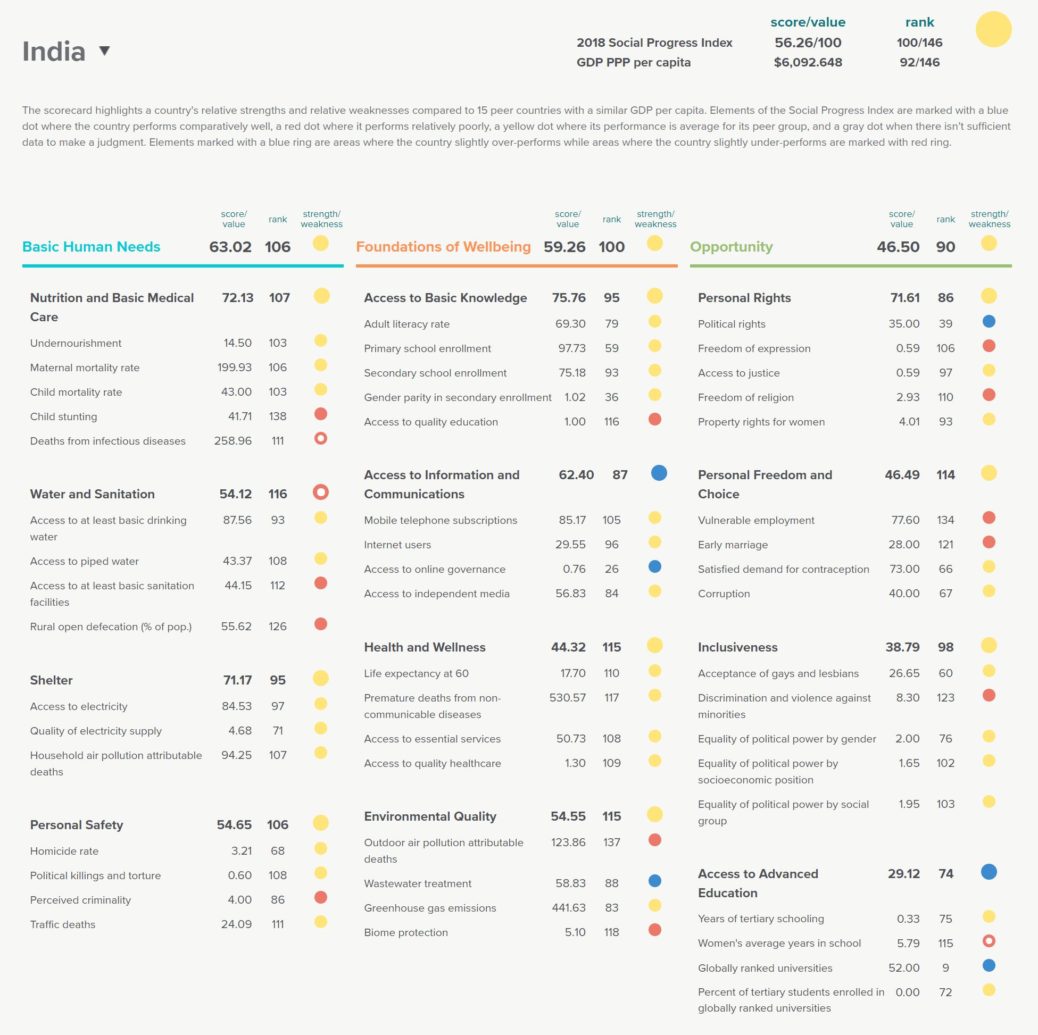
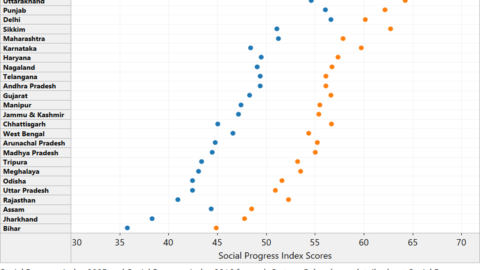
The above scorecard represents the holistic status of India’s social progress in 2018.
Source: Social Progress Imperative
The above scorecard represents the holistic status of India’s social progress in 2018.
Source: Social Progress Imperative
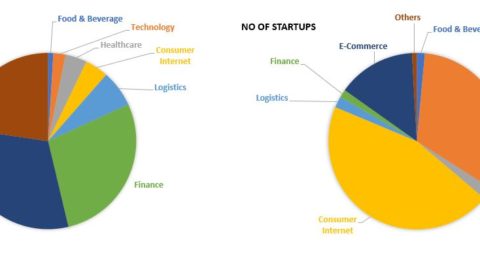
The graph shows the funding trend of start-ups in India across various categories that got funded last year. E-commerce...
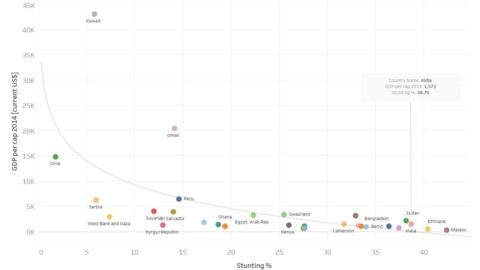
The World Bank estimates that a 1% national shortfall in height can translate into a 1.4% loss in economic...
The above depiction shows how Social Progress Scores of Indian States have changed over the years. Source: Social...
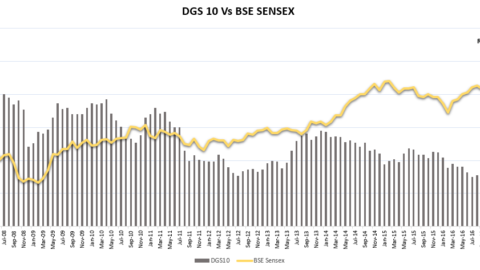
The stock market bloodbath on Tuesday was sparked by no major event but merely market expectations of a rise...
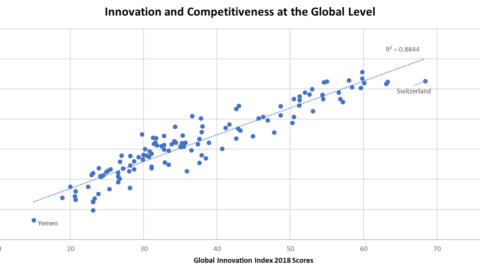
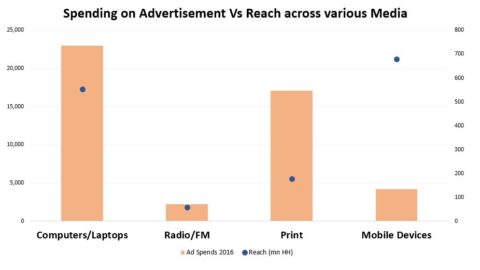
Based on the trend displayed in the graph above, it is evident that there is a stark difference in...
India being the biggest market of smartphones, has helped many brands reach its customers easily and cost effectively. With...
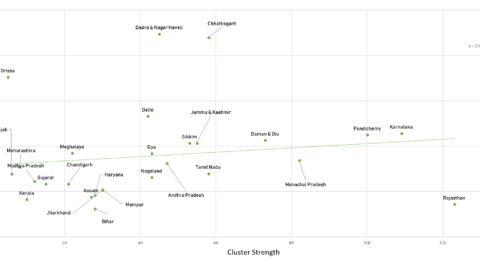
The strength of a region’s cluster portfolio is measured by summing up the performance across its individual clusters. A positive relationship between...