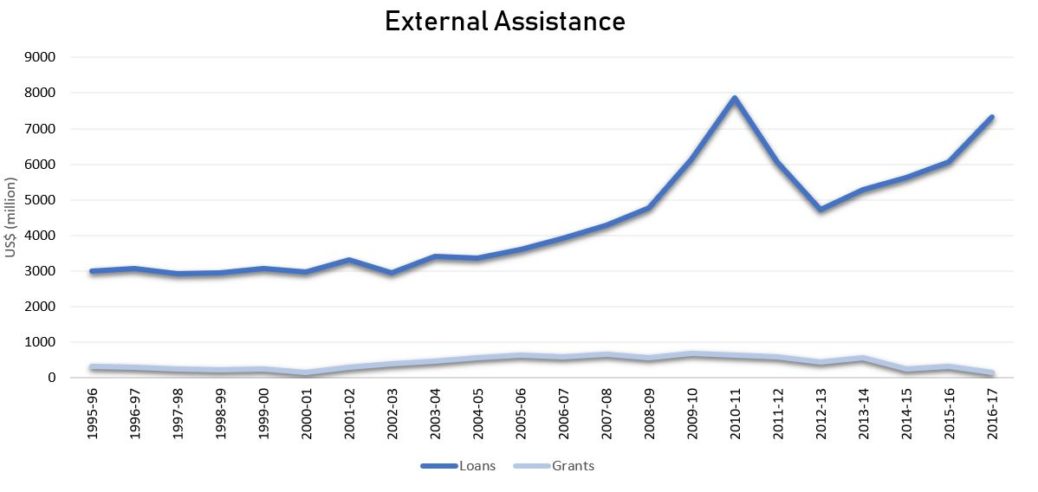
The graph illustrates the comparison between foreign aid that has been received in the form of loans and grants from the mid-1990s till the year 2016-17. It observed a downward trend since 1995-96 till 2000-01. The amount of grants started to pick up after that with a slight dip observed in 2008-09. But then again since 2009-10 a downward trend is being observed with slight volatility.
