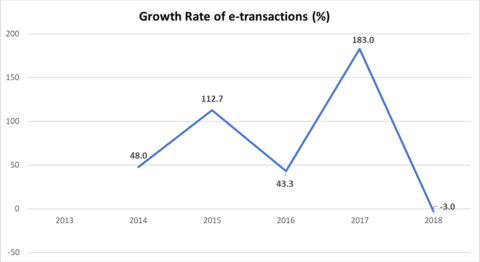
The graph represents the growth of e-Transactions in India from 2014 to 2018. The tremendous rise in digital transactions...
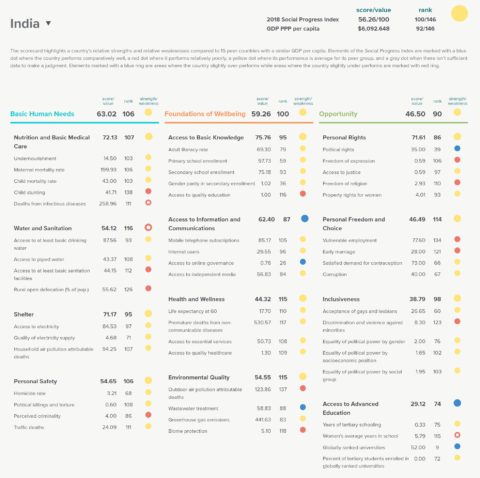
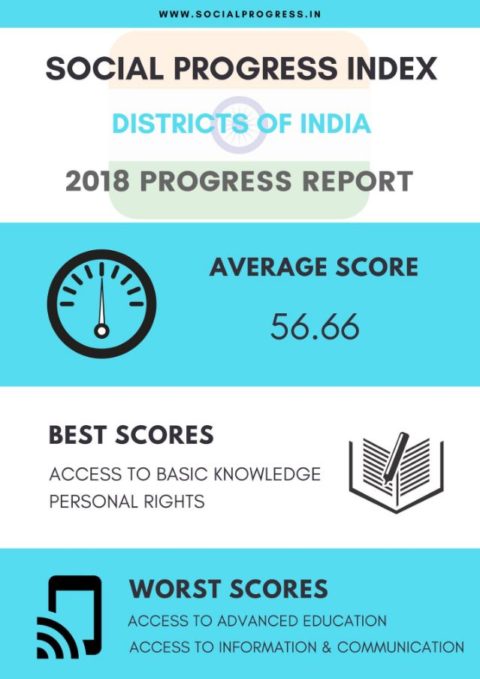
The above scorecard represents the holistic status of India’s social progress in 2018. Source: Social Progress Imperative
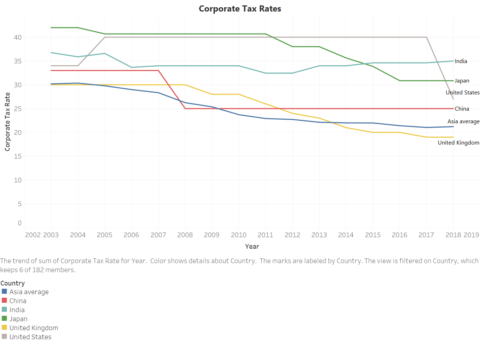
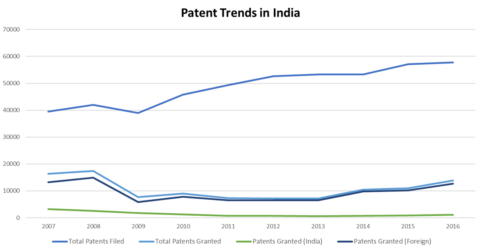
The trends for advanced economies of United Kingdom and United States show differing outcomes, Where UK is visibly declining...
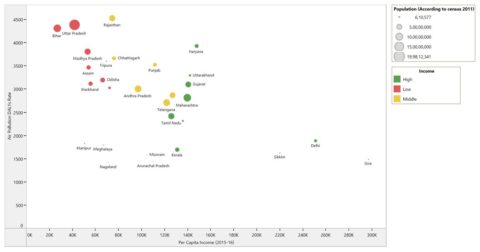
Air pollution DALY’s are high in low and middle-income states compared to high income states. This can be explained...
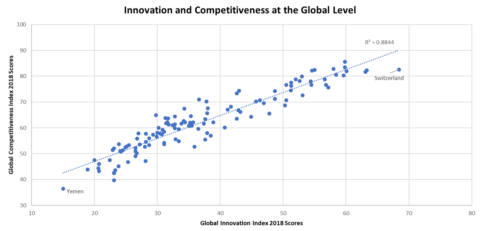
Based on the trend displayed in the graph above, it is evident that there is a stark difference in...
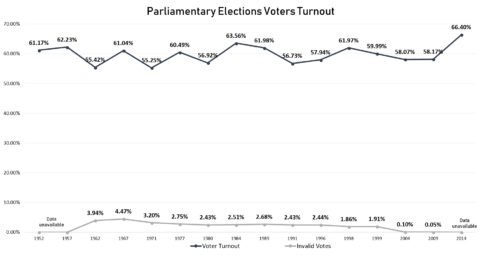
In 2014, voter’s turnout in India hit record high after beating the previous high in 1984 election after prime...
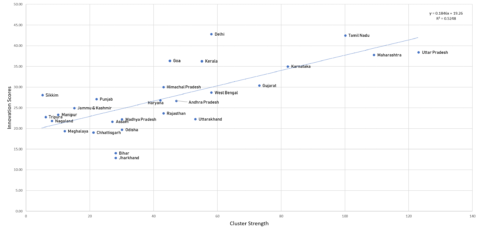
There is a lot of evidence to suggest that clusters provide environment conducive to innovation and knowledge creation. This trend...
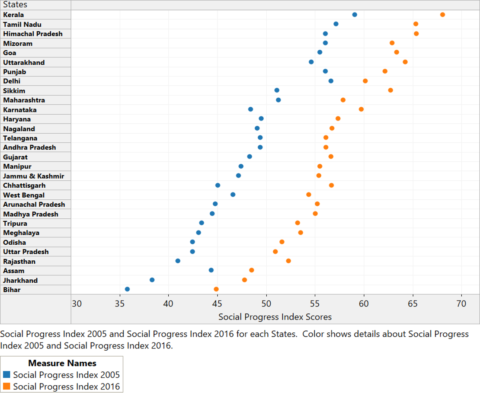
The above depiction shows how Social Progress Scores of Indian States have changed over the years. Source: Social...
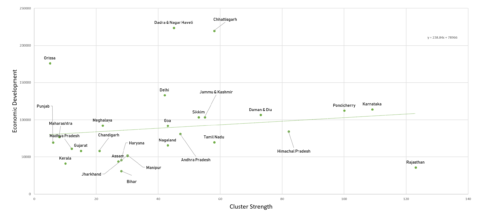
The strength of a region’s cluster portfolio is measured by summing up the performance across its individual clusters. A positive relationship between...
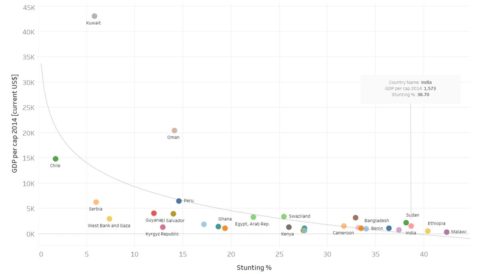
The World Bank estimates that a 1% national shortfall in height can translate into a 1.4% loss in economic...
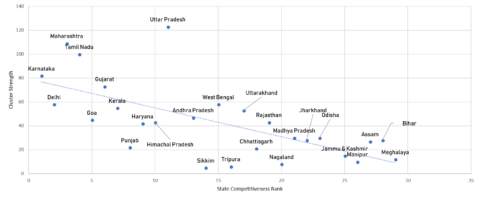
A positive relationship between the state competitiveness and cluster strength is observed. Areas that have strong business environment, better infrastructure...
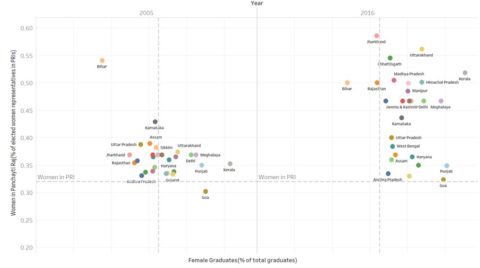
Socio-economic conditions such as illiteracy, prevent the participation of women into running for public office, and even voting. An...
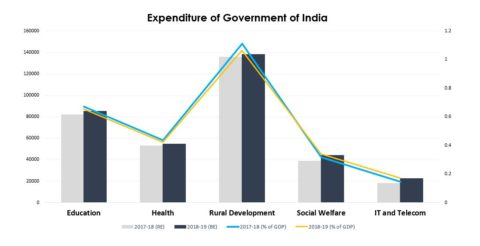
The estimated budget presented by Finance Minister Arun Jaitley for 2018-19 was quite rural focused. The absolute value for expenditure...
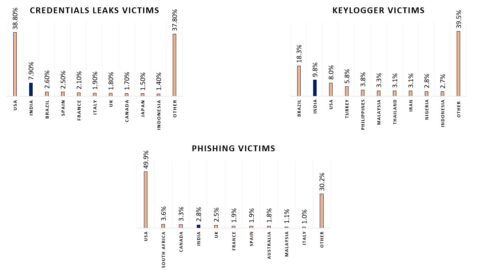
Key-logging or keyboard capturing, is the action of recording (logging) the keys struck on a keyboard, typically covertly, so that the person...
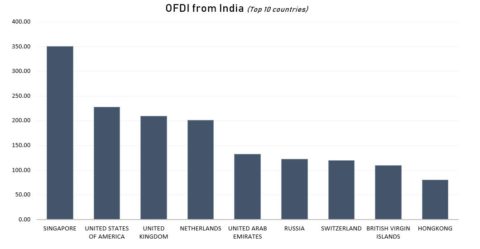
Depicting the outward FDI (USD mn) flow from India for December 2017, the graph shows that Singapore has been...
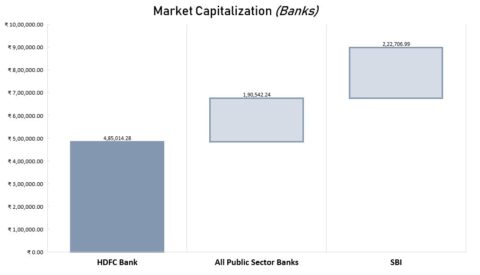
The above graph shows that the market cap of HDFC Bank alone is greater than the combined market cap...
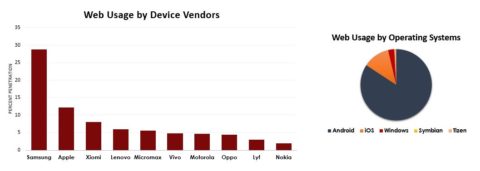
The depiction shows how the web-usage varies across different mobile phone brands and different operating systems. India is among the...
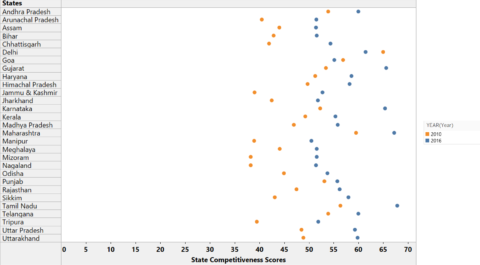
The change in competitiveness scores of Indian States over the years is shown above. Source: State Competitiveness Reports
With new applications coming in on smartphones, the competition between manufacturers is all time high. Bezel less screens, Face...
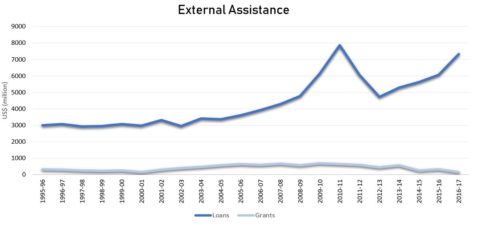
The graph illustrates the comparison between foreign aid that has been received in the form of loans and grants...
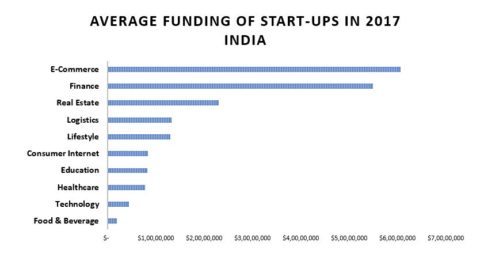
The graph shows the funding trend of start-ups in India across various categories that got funded last year. E-commerce...
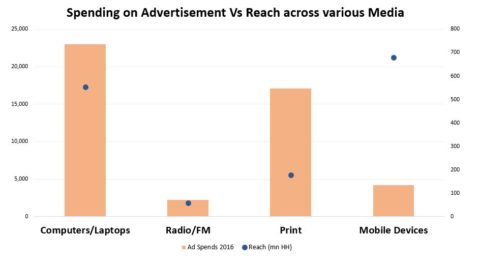
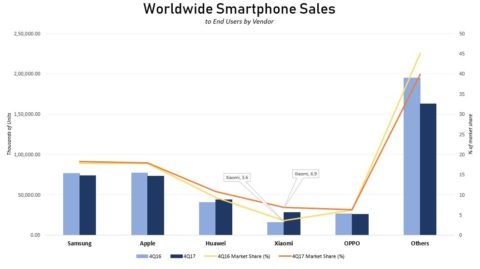
India being the biggest market of smartphones, has helped many brands reach its customers easily and cost effectively. With...
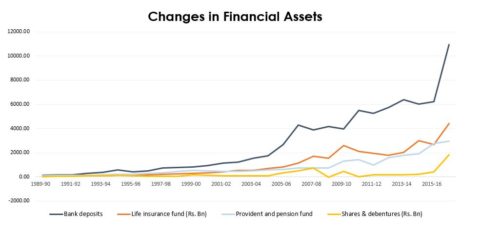
The graph attempts to depict the trends in investments made in Life insurances, Bank Deposits, Provident fund, Shares and...
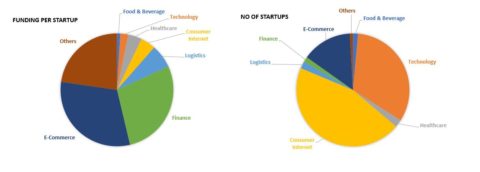
The graph shows the funding trend of start-ups in India across various categories that got funded last year. E-commerce...
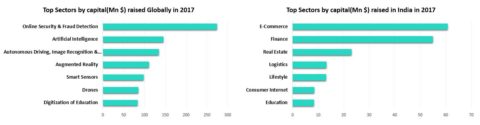
Global investment trends are skewed towards sectors that have not yet found their place in India. We see online...
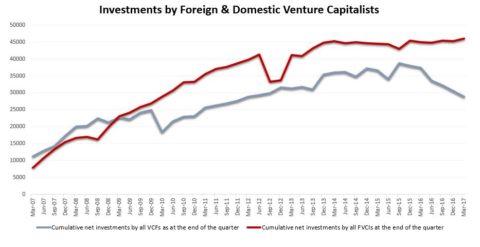
The graph represents how well Indian markets are attracting foreign venture capitalists across various sectors. It is clear from...
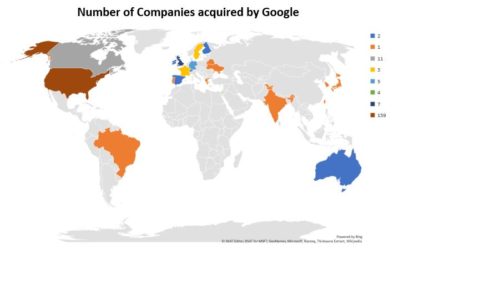
The map shows the number of companies and start-ups acquired by Google till date. Source: Wikipedia
With inexpensive smartphones and data plans, Indians who are getting online for the first time are causing trouble for...
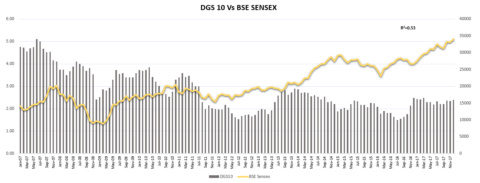
The stock market bloodbath on Tuesday was sparked by no major event but merely market expectations of a rise...