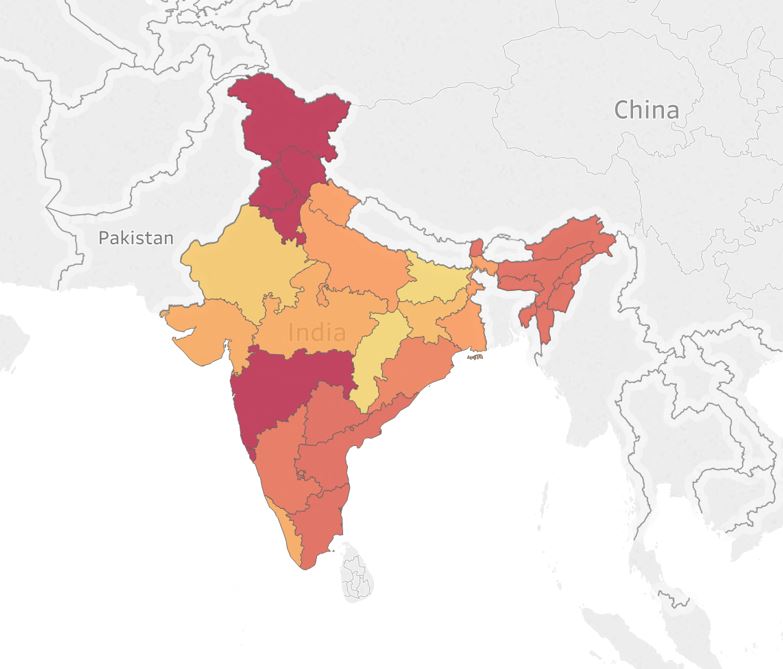
The tool represents how television viewership vary across various states in India. It presents surprising results when different sports are under observation. Also, the results are slightly in sync with the productivity of the States.

This interactive tool visualizes how the increase in internet subscribers has affected the GDP per capita of various countries....
The above tool represents how the change in fertility rates i.e. babies per woman affect the economic development of...
The above tool represents the net payroll subscribers in the formal sector for past one year. The...
The tool visualizes how GDP per capita varies with Market Capitalization of publicly listed companies across various countries. It...
The above tool has been developed by using data from authentic government sources to gain better insights from...
The above tool depicts the trends in growth of Labor Productivity per person employed from 1950 till 2017. Data...
Kashish Arora
Data Analyst
kashish.arora@competitiveness.in