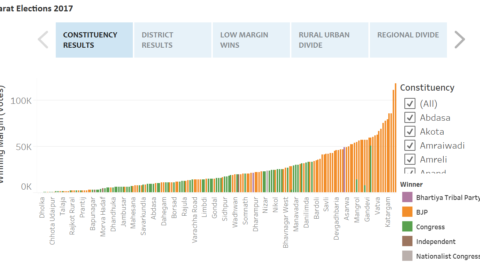
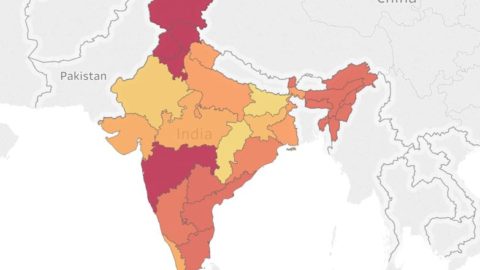
The tool visualizes how GDP per capita varies with Market Capitalization of publicly listed companies across various countries. It clearly represents how Global markets fell during Global Financial Crisis in 2007-2008 and Black Monday of 2011.
(For interesting results deselect Hong Kong SAR & Luxembourg)


