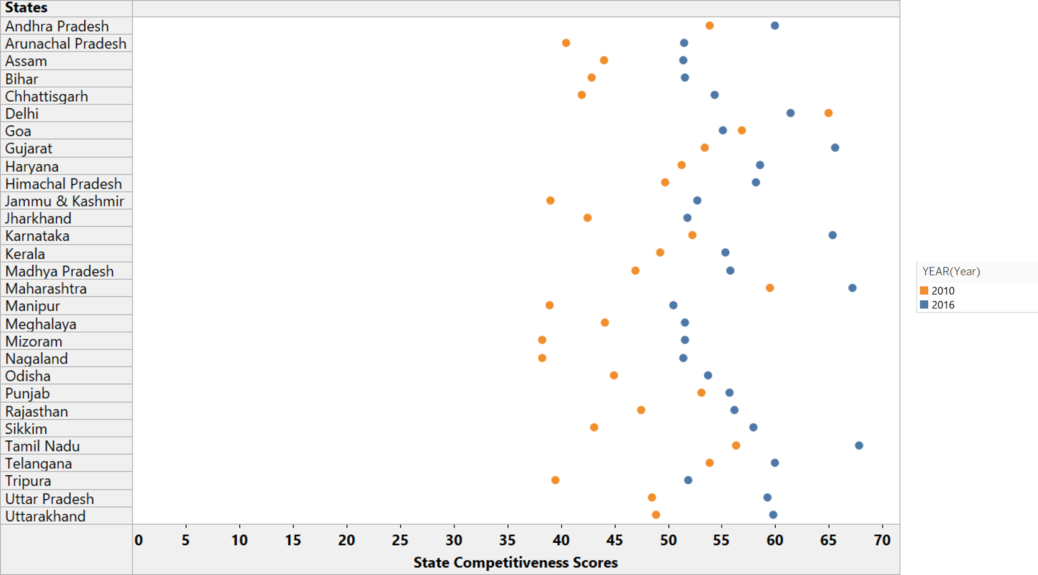
The change in competitiveness scores of Indian States over the years is shown above.
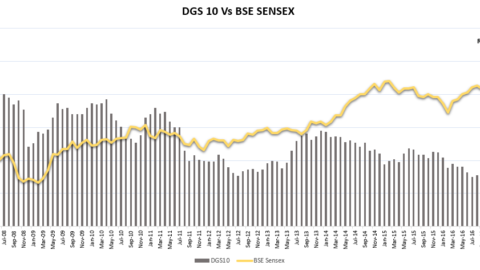
The stock market bloodbath on Tuesday was sparked by no major event but merely market expectations of a rise...
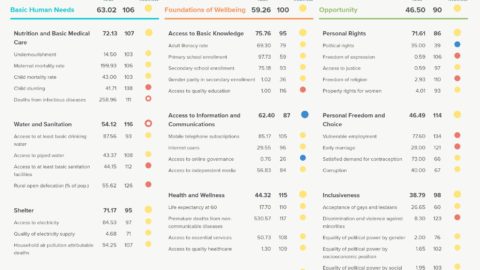
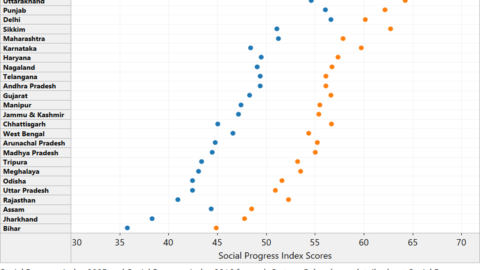
The above scorecard represents the holistic status of India’s social progress in 2018. Source: Social Progress Imperative
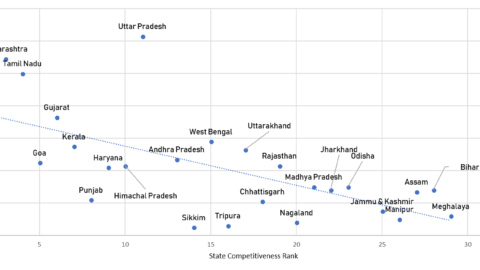
A positive relationship between the state competitiveness and cluster strength is observed. Areas that have strong business environment, better infrastructure...
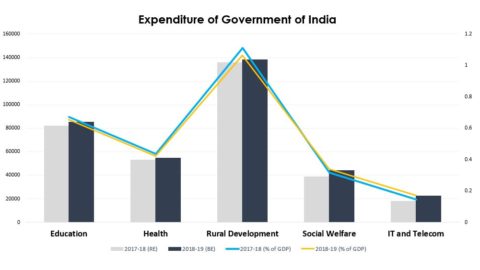
The estimated budget presented by Finance Minister Arun Jaitley for 2018-19 was quite rural focused. The absolute value for expenditure...
The above depiction shows how Social Progress Scores of Indian States have changed over the years. Source: Social...
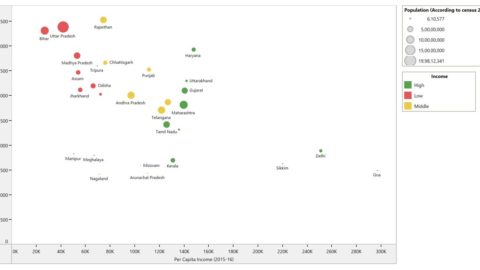
Air pollution DALY’s are high in low and middle-income states compared to high income states. This can be explained...
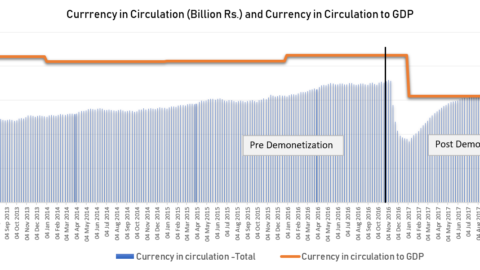
Based on the trend displayed in the graph above, it is evident that there is a stark difference in...
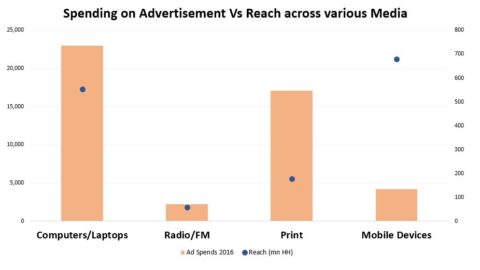
India being the biggest market of smartphones, has helped many brands reach its customers easily and cost effectively. With...