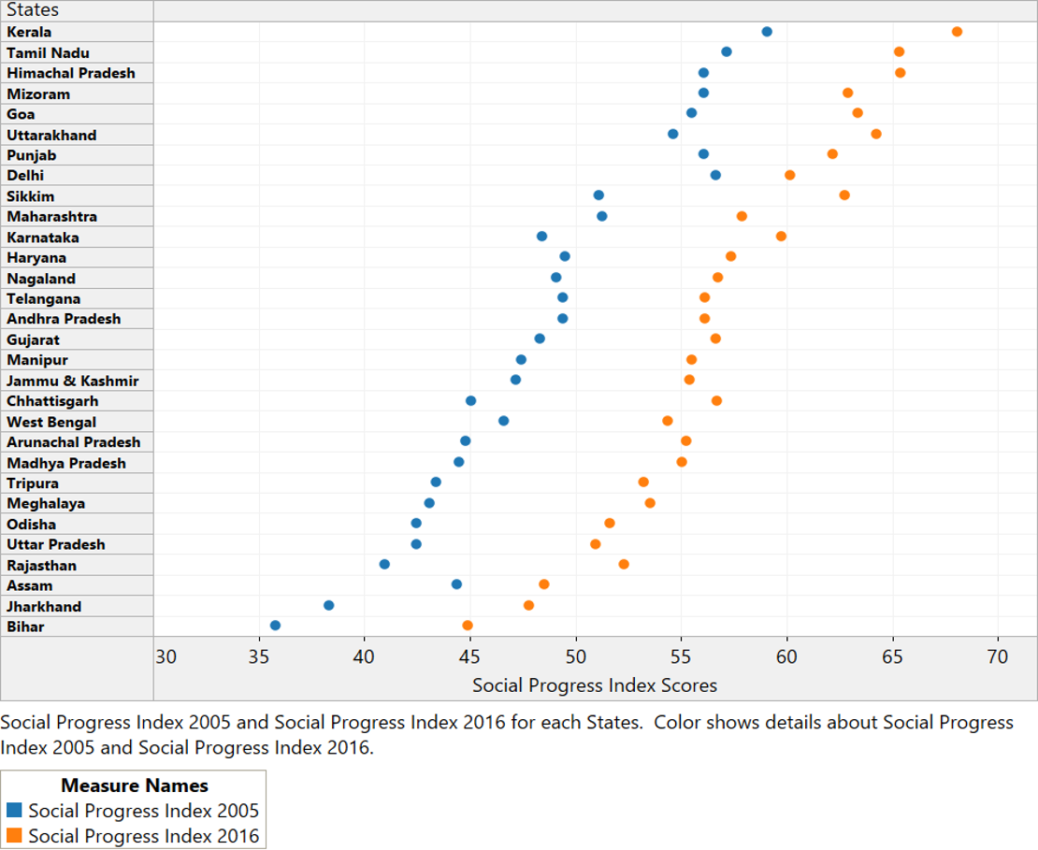
The above depiction shows how Social Progress Scores of Indian States have changed over the years.
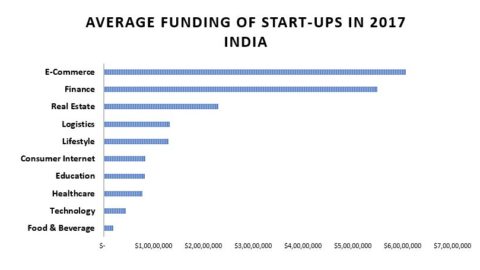
The graph shows the funding trend of start-ups in India across various categories that got funded last year. E-commerce...
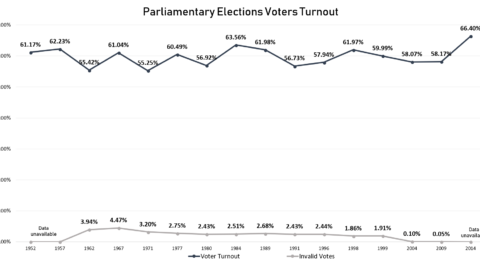
In 2014, voter’s turnout in India hit record high after beating the previous high in 1984 election after prime...
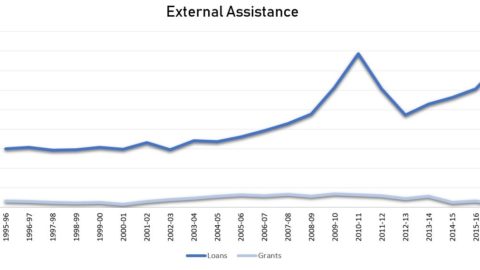
The graph illustrates the comparison between foreign aid that has been received in the form of loans and grants...
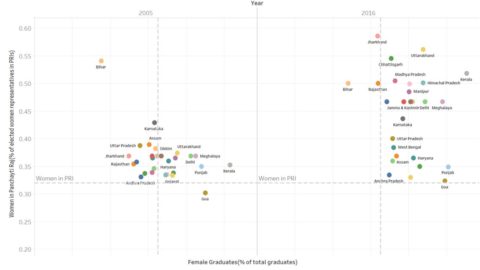
Socio-economic conditions such as illiteracy, prevent the participation of women into running for public office, and even voting. An...
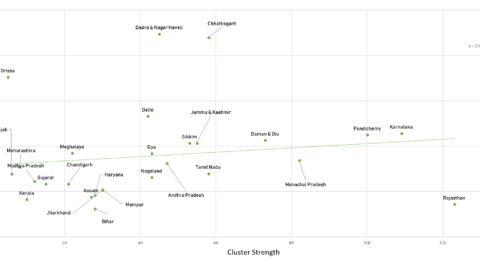
The strength of a region’s cluster portfolio is measured by summing up the performance across its individual clusters. A positive relationship between...
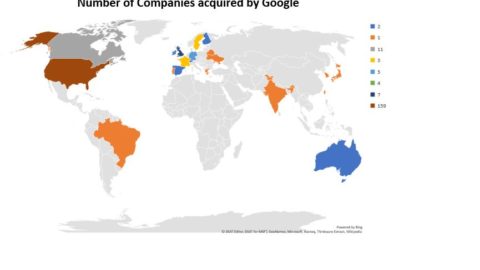
The map shows the number of companies and start-ups acquired by Google till date. Source: Wikipedia
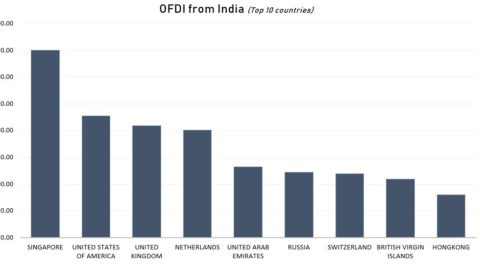
Depicting the outward FDI (USD mn) flow from India for December 2017, the graph shows that Singapore has been...
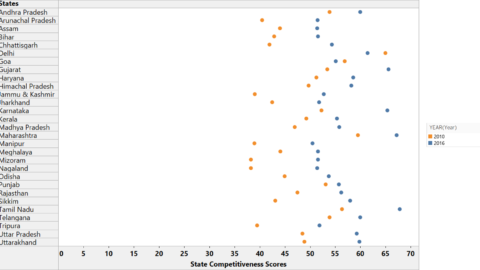
The change in competitiveness scores of Indian States over the years is shown above. Source: State Competitiveness Reports