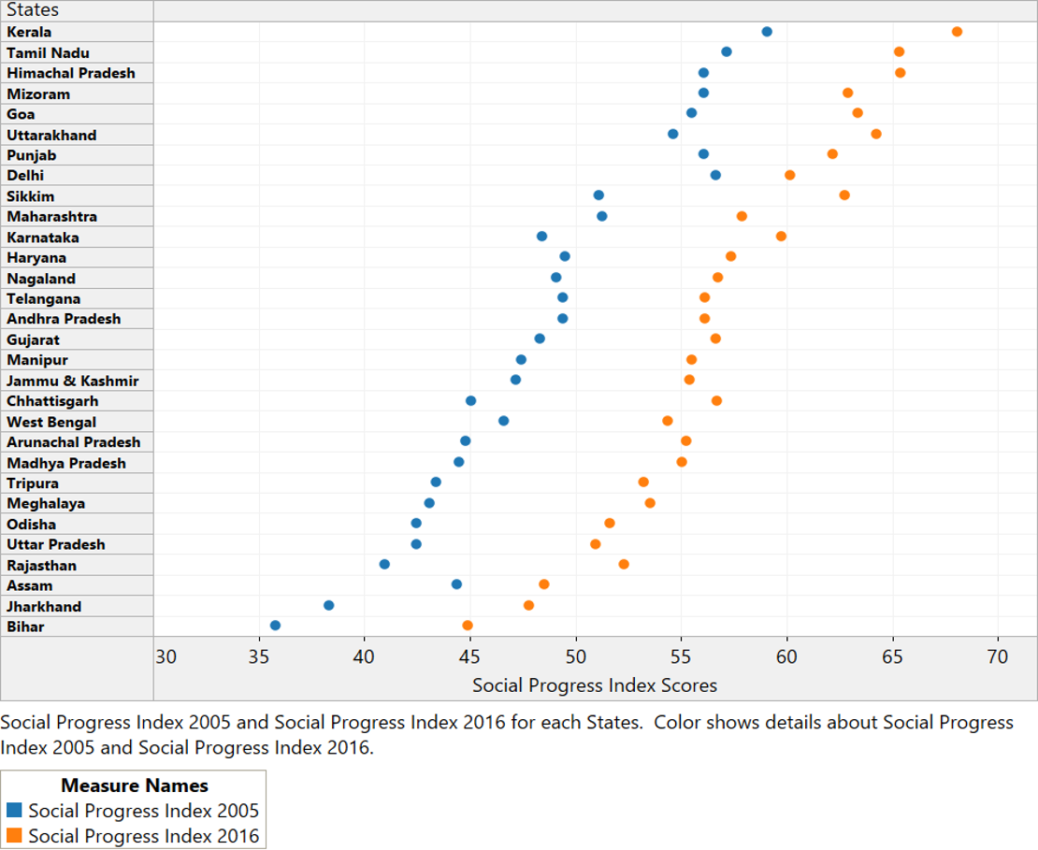
The above depiction shows how Social Progress Scores of Indian States have changed over the years.
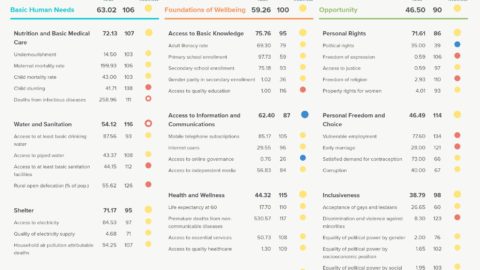
The above scorecard represents the holistic status of India’s social progress in 2018. Source: Social Progress Imperative
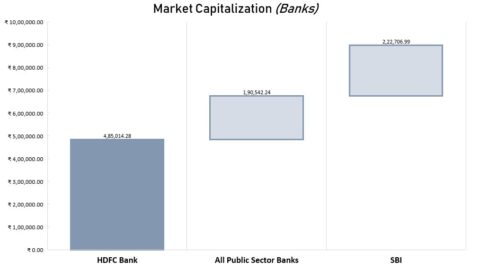
The above graph shows that the market cap of HDFC Bank alone is greater than the combined market cap...
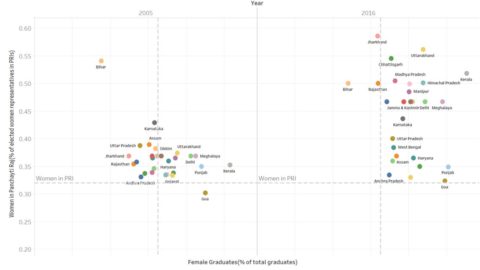
Socio-economic conditions such as illiteracy, prevent the participation of women into running for public office, and even voting. An...
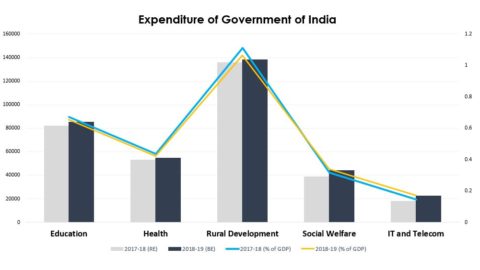
The estimated budget presented by Finance Minister Arun Jaitley for 2018-19 was quite rural focused. The absolute value for expenditure...
Based on the trend displayed in the graph above, it is evident that there is a stark difference in...
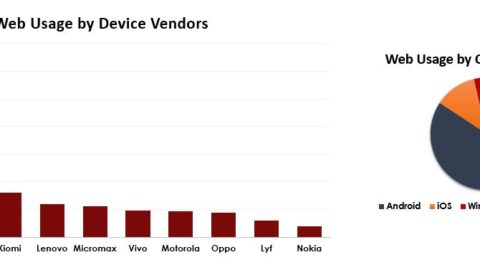
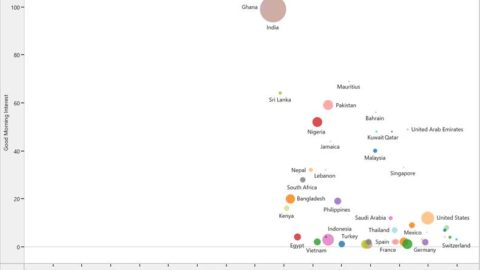
The depiction shows how the web-usage varies across different mobile phone brands and different operating systems. India is among the...
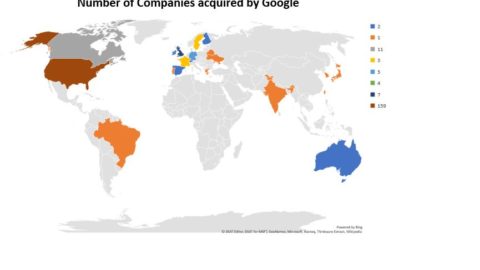
The map shows the number of companies and start-ups acquired by Google till date. Source: Wikipedia
With inexpensive smartphones and data plans, Indians who are getting online for the first time are causing trouble for...