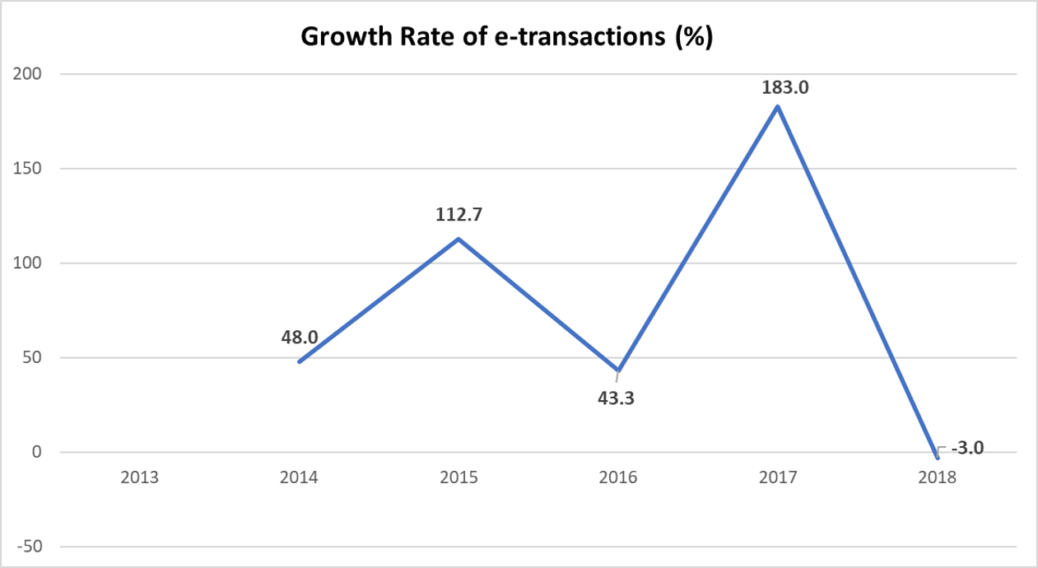
The graph represents the growth of e-Transactions in India from 2014 to 2018. The tremendous rise in digital transactions from 2016 to 2017 can be explained because of demonetization and digital inclusion. In 2018, however, several rules and regulations such as mandatory KYC for digital wallets and UPIs led to the decline of e-transactions.
e-Transactions in India
+91 124 437 6676 [email protected]
-
BSE Sensex and US Bond Market
, , Static, 0
The stock market bloodbath on Tuesday was sparked by no major event but merely market expectations of a rise...
-
Cluster Strength and Innovation
, , Static, 0
There is a lot of evidence to suggest that clusters provide environment conducive to innovation and knowledge creation. This trend...
-
Social Progress Index India 2018
, , Static, 0
The above scorecard represents the holistic status of India’s social progress in 2018. Source: Social Progress Imperative
-
Web-Usage between top Device vendors
, , Static, 0
The depiction shows how the web-usage varies across different mobile phone brands and different operating systems. India is among the...
-
Number of funded Start-ups in 2017
, , Static, 0
The graph shows the funding trend of start-ups in India across various categories that got funded last year. E-commerce...
-
-
Social Progress Index
, , Static, 0
The above depiction shows how Social Progress Scores of Indian States have changed over the years. Source: Social...
-
External Assistance
, , Static, 0
The graph illustrates the comparison between foreign aid that has been received in the form of loans and grants...