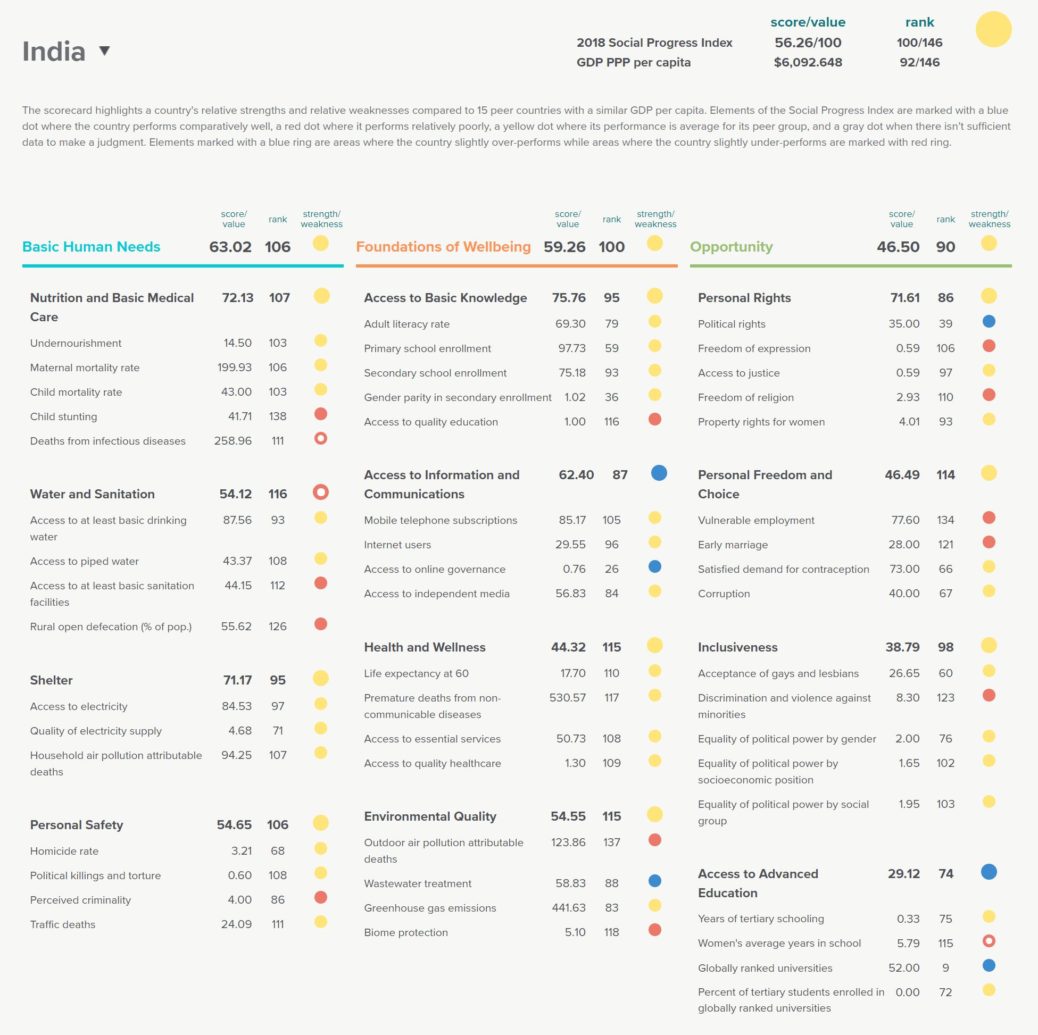
The above scorecard represents the holistic status of India’s social progress in 2018.
Source: Social Progress Imperative
The above scorecard represents the holistic status of India’s social progress in 2018.
Source: Social Progress Imperative
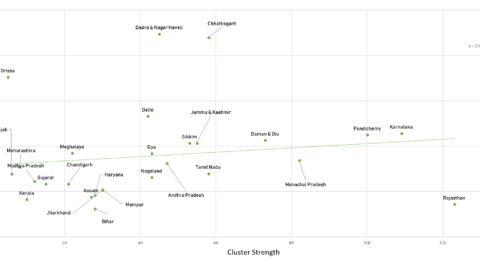
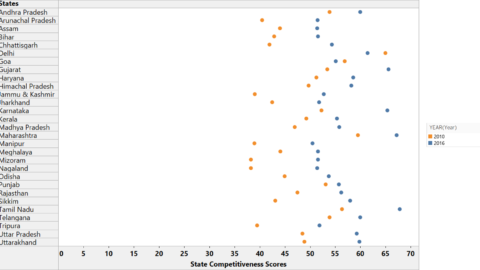
A positive relationship between the state competitiveness and cluster strength is observed. Areas that have strong business environment, better infrastructure...
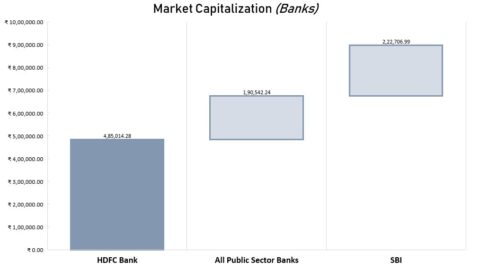
The above graph shows that the market cap of HDFC Bank alone is greater than the combined market cap...
The strength of a region’s cluster portfolio is measured by summing up the performance across its individual clusters. A positive relationship between...
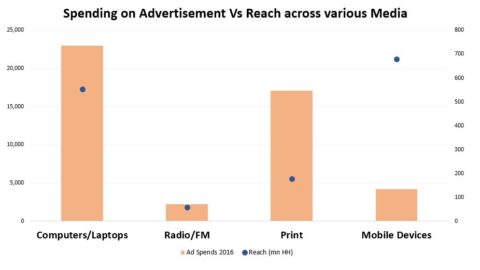
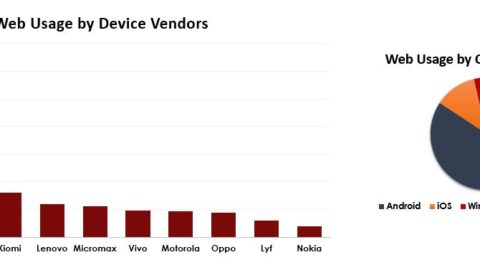
India being the biggest market of smartphones, has helped many brands reach its customers easily and cost effectively. With...
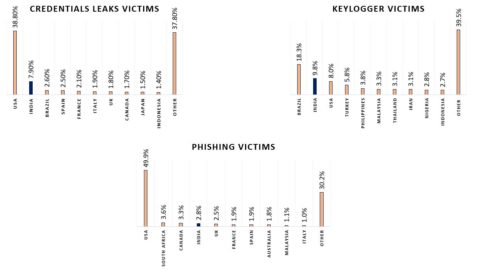
Key-logging or keyboard capturing, is the action of recording (logging) the keys struck on a keyboard, typically covertly, so that the person...
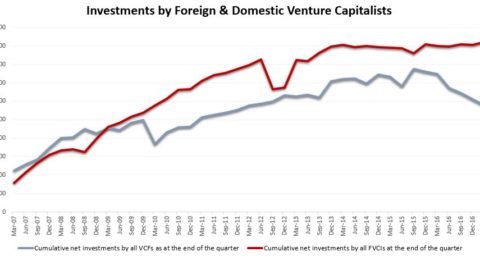
The graph represents how well Indian markets are attracting foreign venture capitalists across various sectors. It is clear from...
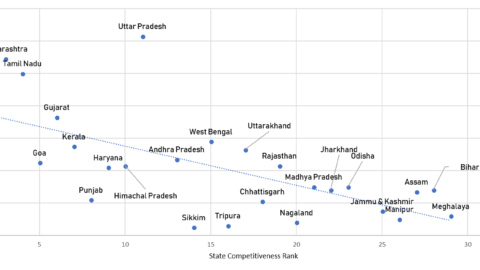
The change in competitiveness scores of Indian States over the years is shown above. Source: State Competitiveness Reports
The depiction shows how the web-usage varies across different mobile phone brands and different operating systems. India is among the...