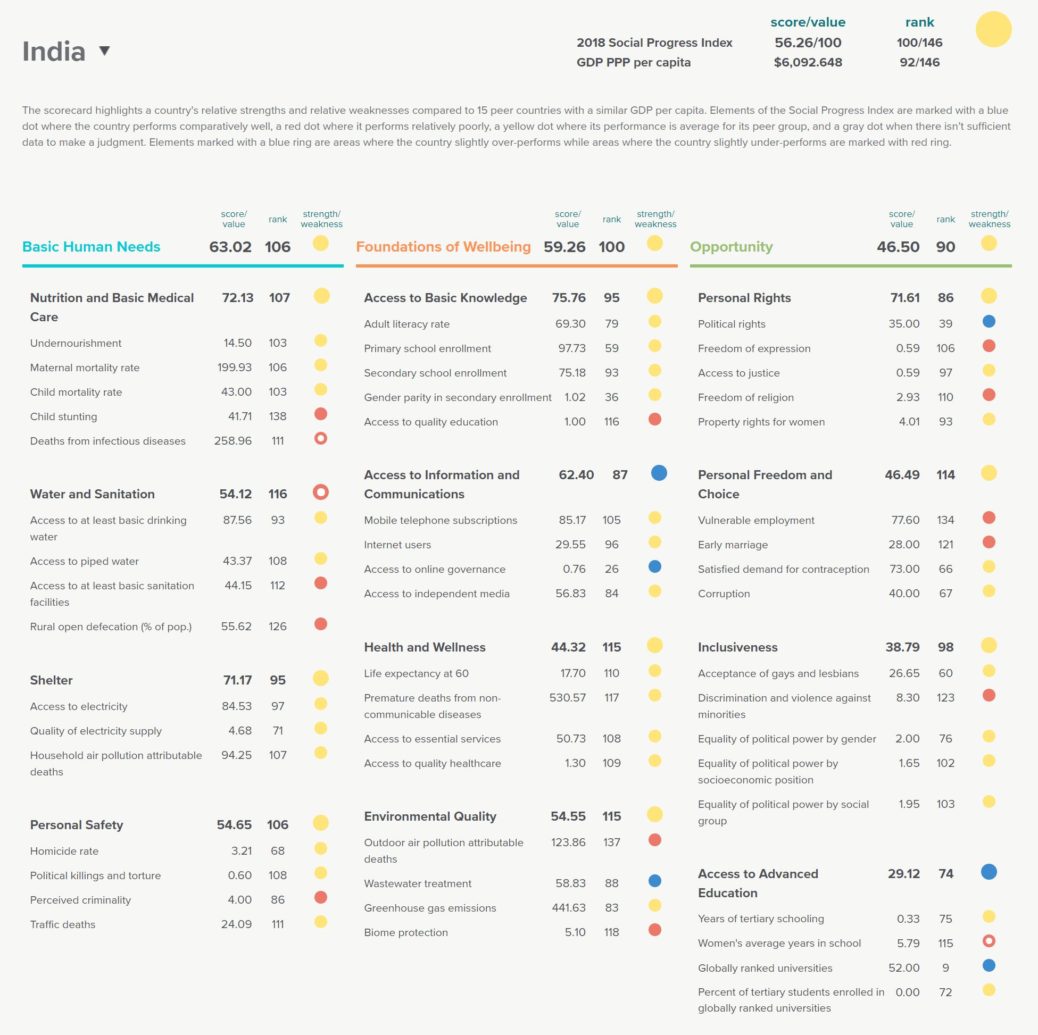
The above scorecard represents the holistic status of India’s social progress in 2018.
Source: Social Progress Imperative
The above scorecard represents the holistic status of India’s social progress in 2018.
Source: Social Progress Imperative
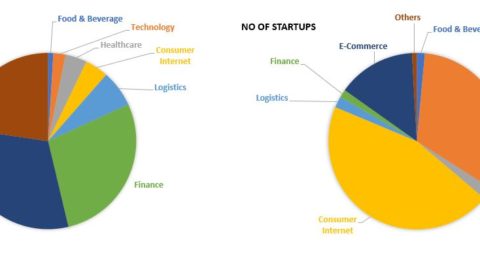
The graph shows the funding trend of start-ups in India across various categories that got funded last year. E-commerce...
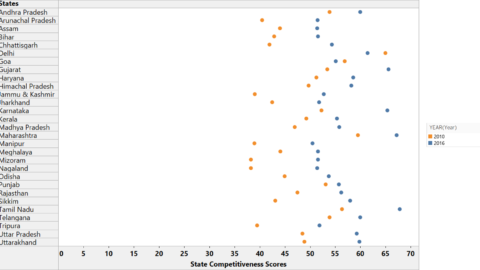
The change in competitiveness scores of Indian States over the years is shown above. Source: State Competitiveness Reports
The stock market bloodbath on Tuesday was sparked by no major event but merely market expectations of a rise...
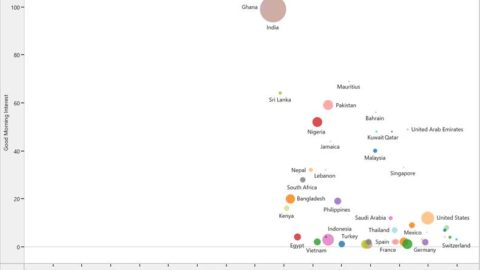
With inexpensive smartphones and data plans, Indians who are getting online for the first time are causing trouble for...
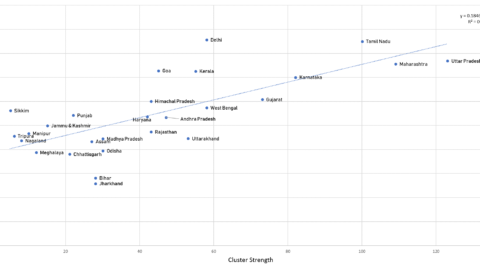
There is a lot of evidence to suggest that clusters provide environment conducive to innovation and knowledge creation. This trend...
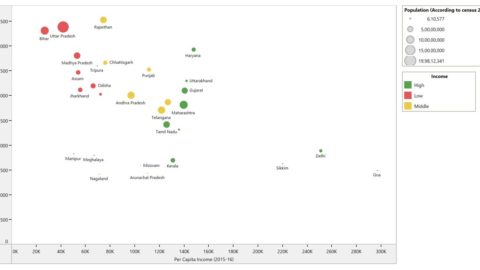
Air pollution DALY’s are high in low and middle-income states compared to high income states. This can be explained...
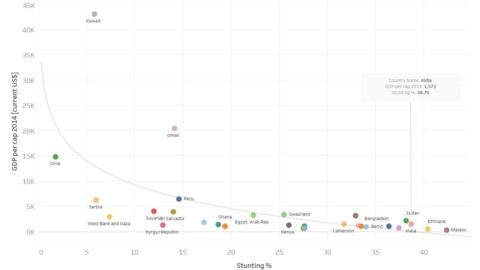
The World Bank estimates that a 1% national shortfall in height can translate into a 1.4% loss in economic...
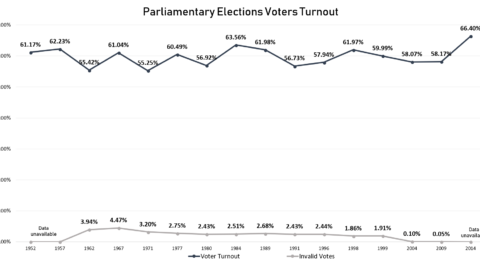
In 2014, voter’s turnout in India hit record high after beating the previous high in 1984 election after prime...