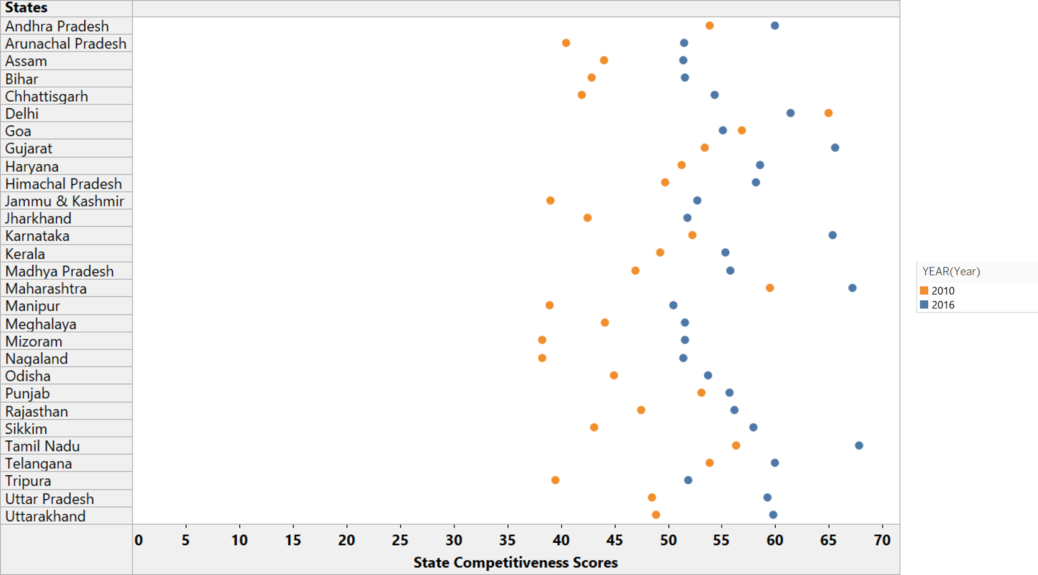
The change in competitiveness scores of Indian States over the years is shown above.
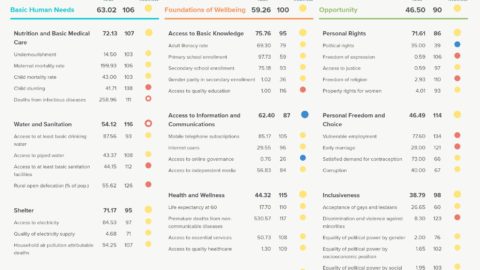
The above scorecard represents the holistic status of India’s social progress in 2018. Source: Social Progress Imperative
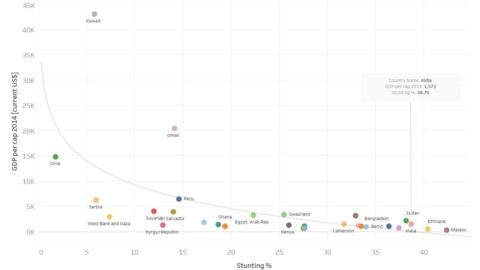
The World Bank estimates that a 1% national shortfall in height can translate into a 1.4% loss in economic...
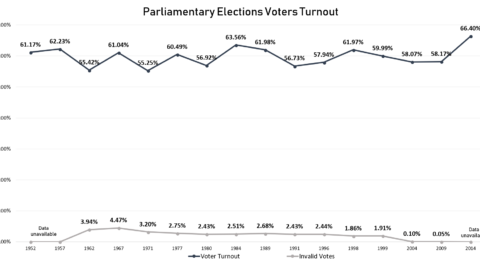
In 2014, voter’s turnout in India hit record high after beating the previous high in 1984 election after prime...
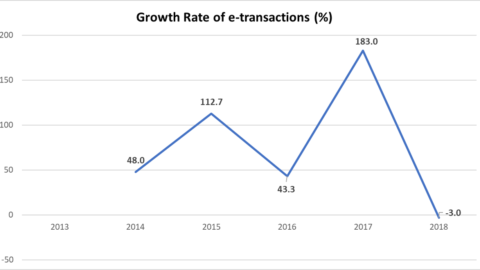
The graph represents the growth of e-Transactions in India from 2014 to 2018. The tremendous rise in digital transactions...
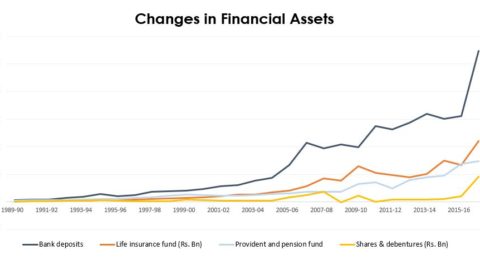
The graph attempts to depict the trends in investments made in Life insurances, Bank Deposits, Provident fund, Shares and...
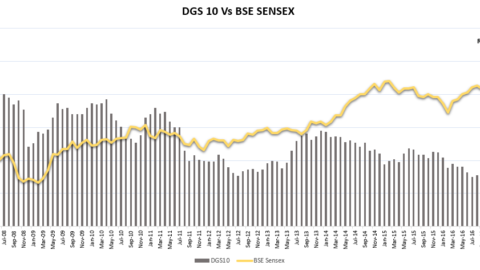
The stock market bloodbath on Tuesday was sparked by no major event but merely market expectations of a rise...
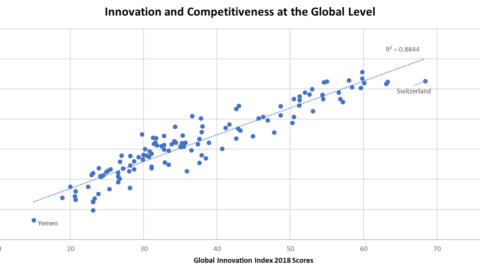
Based on the trend displayed in the graph above, it is evident that there is a stark difference in...