
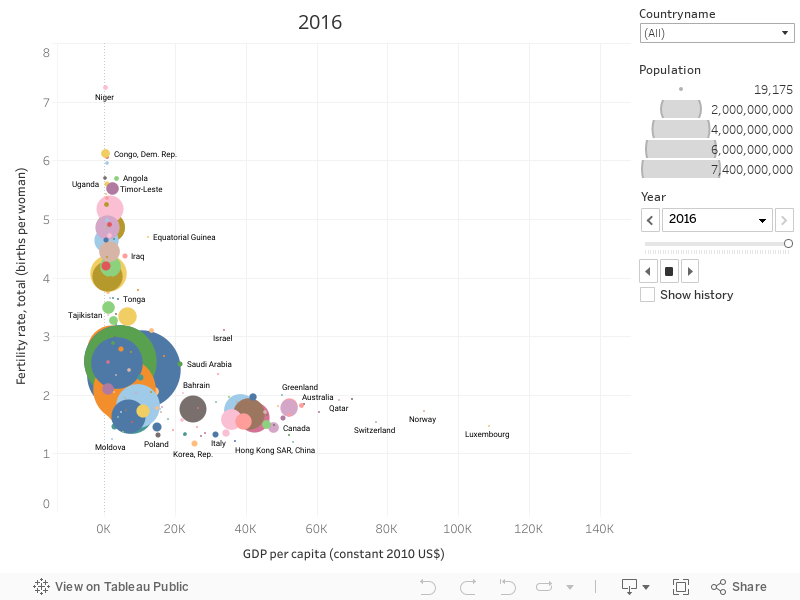
The above tool represents how the change in fertility rates i.e. babies per woman affect the economic development of...
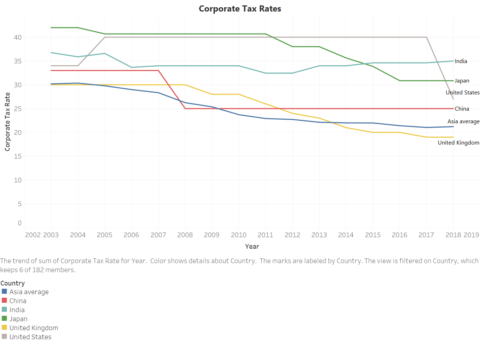
The trends for advanced economies of United Kingdom and United States show differing outcomes, Where UK is visibly declining...
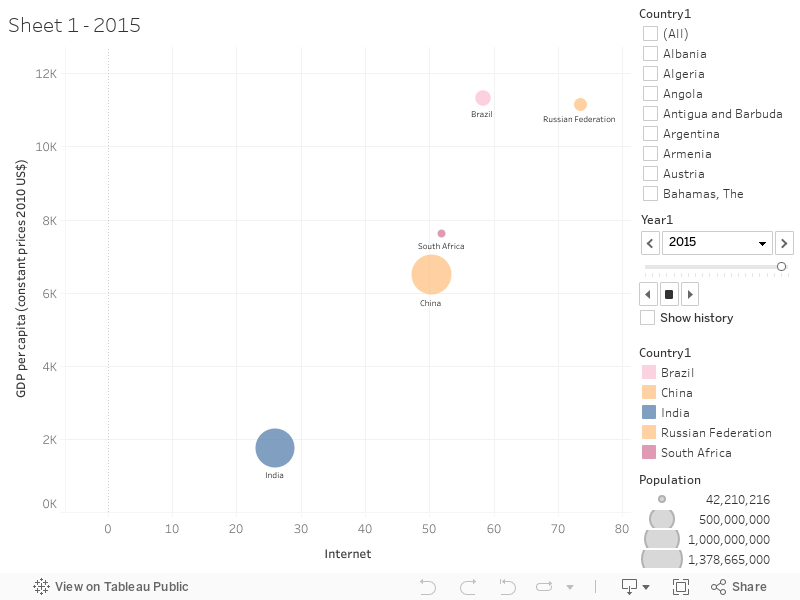
This interactive tool visualizes how the increase in internet subscribers has affected the GDP per capita of various countries....
The graph is a visualization of trends in the enrollment rate and the corresponding learning outcomes for the 15...
Recent Comments