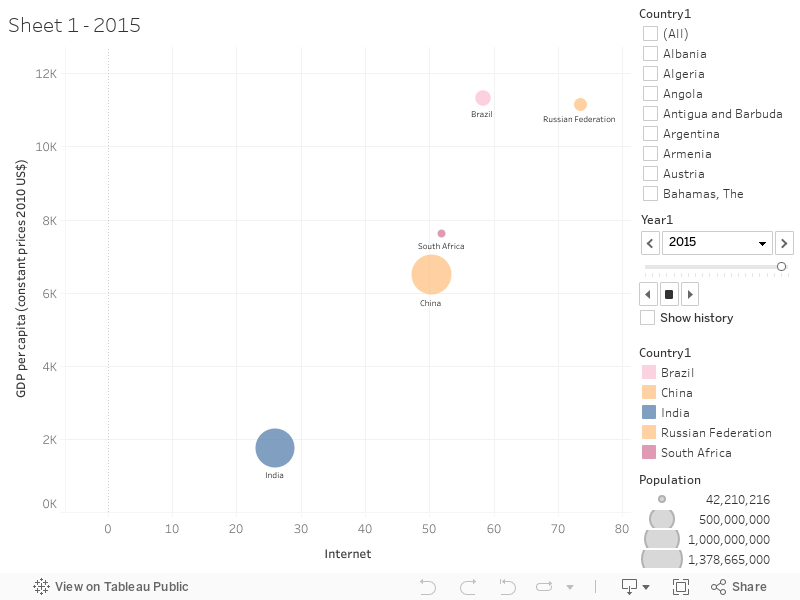
This interactive tool visualizes how the increase in internet subscribers has affected the GDP per capita of various countries....
The graph is a visualization of trends in the enrollment rate and the corresponding learning outcomes for the 15...
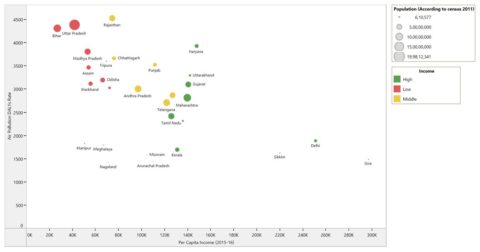
Air pollution DALY’s are high in low and middle-income states compared to high income states. This can be explained...
Based on the trend displayed in the graph above, it is evident that there is a stark difference in...
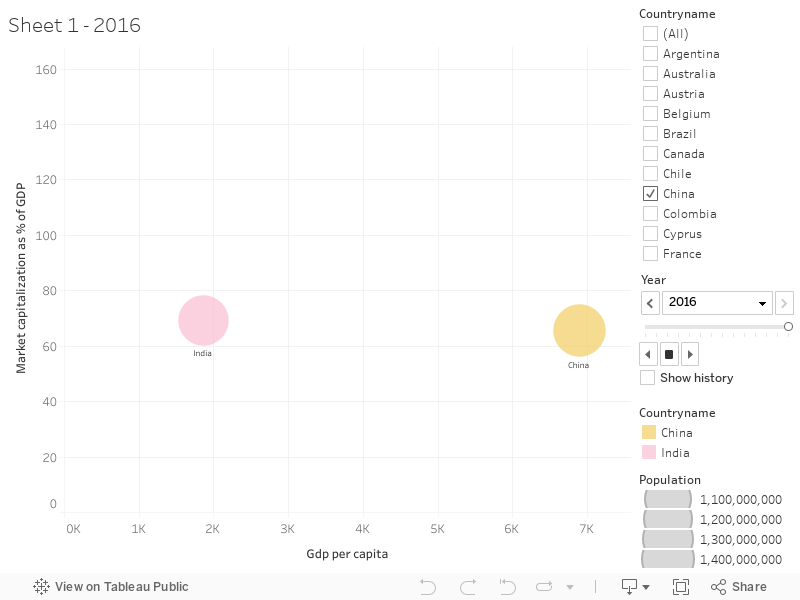
The tool visualizes how GDP per capita varies with Market Capitalization of publicly listed companies across various countries. It...
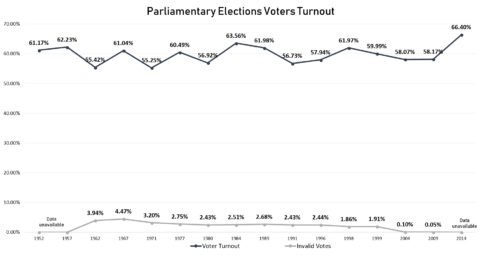
In 2014, voter’s turnout in India hit record high after beating the previous high in 1984 election after prime...
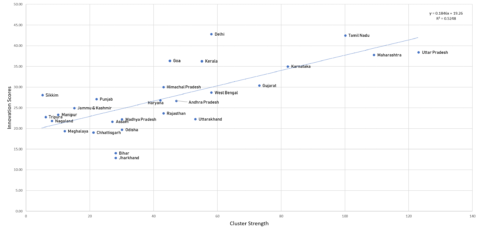
There is a lot of evidence to suggest that clusters provide environment conducive to innovation and knowledge creation. This trend...
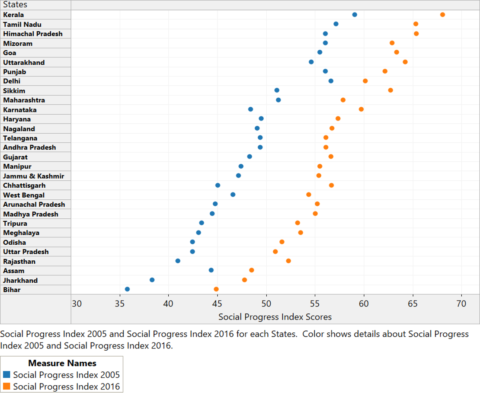
The above depiction shows how Social Progress Scores of Indian States have changed over the years. Source: Social...
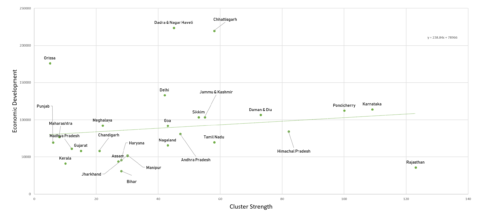
The strength of a region’s cluster portfolio is measured by summing up the performance across its individual clusters. A positive relationship between...
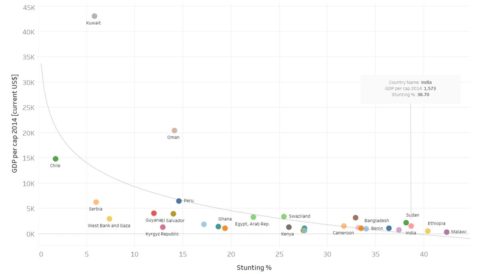
The World Bank estimates that a 1% national shortfall in height can translate into a 1.4% loss in economic...
Recent Comments